Learning targets

Georgia SPS4.b — Use mathematics and computational thinking to explain the process of half-life as it relates to radioactive decay.
Target 1 · What half-life means
  • I can define half-life as the time for half of a radioactive sample to decay.
  • I can explain why half-life does not change with temperature, pressure, or sample size.
Target 2 · Halving tables
  • I can build a table showing how much of a sample remains after each half-life.
  • I can find the fraction and percentage remaining after any number of half-lives.
Target 3 · The formula
  • I can use N = N0(½)n to find the amount remaining.
  • I can rearrange it to find the elapsed time, the starting amount, or the number of half-lives.
Target 4 · Decay curves
  • I can read an amount or a time off a decay curve.
  • I can explain why the curve flattens instead of hitting zero.

One sentence, then everything else follows

Half-life
The time it takes for half of the radioactive atoms in a sample to decay. Not half the time until it is gone. Not half the sample forever. Just: wait one half-life, and half of what you had is gone.
Four panels showing fewer and fewer glowing atoms as grey decayed atoms take their place
Same sample, four snapshots, one half-life apart. The colored atoms are the ones that have not decayed yet. Grey ones already have.
The same halving, running. Notice it slows down — not because the atoms change, but because there are fewer left to decay.
Four things students say that are wrong, and this page will keep arguing with:
  • "Half-life is half the time until it is all gone." It is not a countdown to zero at all.
  • "After two half-lives it is all gone." After two half-lives you have one quarter left. Half, then half of that.
  • "You subtract the same amount each time." No — you halve each time. 80 → 40 → 20 → 10, not 80 → 40 → 0.
  • "Heating it or having more of it changes the half-life." It does not. Half-life is a property of the isotope and nothing else touches it.

The Decay Simulator

Four hundred atoms. Each one decays at random — but with that many, the pattern is dead reliable. Press Run and watch the curve draw itself.

Speed
0
half-lives elapsed
400
atoms remaining
100%
of the original
400
predicted by the math
Press Run. Watch the "remaining" number against the "predicted" number — they will stay close, but they will almost never match exactly.
Why they never match exactly. No atom knows it is "due." Each one has the same chance of decaying in the next moment, and which ones actually go is pure luck. With 400 atoms the randomness mostly averages out. With 10 atoms it would be chaos. With the trillions of atoms in a real sample, the curve is so smooth you can set a clock by it — and that is exactly what carbon dating does.

Method 1: the halving table

Slow, but almost impossible to get wrong. Start with what you have and cut it in half, once per half-life.

Isotope: Starting amount:

Method 2: the formula

N = N0 × (½)n    where    n = tt½
N — how much is left
N0 — how much you started with
n — how many half-lives have passed
t — total time elapsed
t½ — the half-life of the isotope
Always do it in two steps. Step one: find n by dividing the total time by the half-life. Step two: halve the starting amount n times. Students who try to do it in one move are the ones who get it wrong.

Worked both directions

Forwards — find what is left
A hospital has 80 mg of iodine-131 (half-life 8 days). How much remains after 32 days?
n = 32 ÷ 8 = 4 half-lives
N = 80 × (½)4 = 80 × 116 = 5 mg
Check by halving: 80 → 40 → 20 → 10 → 5. Four arrows, four half-lives.
Backwards — find the time
A sample of cobalt-60 (half-life 5.27 years) has dropped from 64 g to 8 g. How long did that take?
64 → 32 → 16 → 8, so n = 3 half-lives
t = n × t½ = 3 × 5.27 = 15.81 years
Count the arrows to get n, then multiply. Never divide the masses by each other and stop there.

Method 3: read it off the curve

Click any point on the curve. The dashed lines show you how to trace a value across and down.

Isotope:
Click a point on the curve above.
Why the curve flattens but never touches zero. Every half-life removes half of what is left, not a fixed amount. Half of a small number is a smaller number, so the steps keep shrinking. Mathematically it never reaches zero. In the real world you eventually get down to the last few atoms, and then it really is just luck.

Real isotopes, real half-lives

The range is absurd — from seconds to billions of years. That range is exactly why different isotopes get used for different jobs.

Notice the pattern. Short half-life means it decays fast, which means it is intensely radioactive but gone quickly — perfect for a medical tracer you want out of a patient by tomorrow. Long half-life means it is barely radioactive at all, but it will still be there in a hundred thousand years — which is the entire problem with nuclear waste.

Where this gets used: dating things

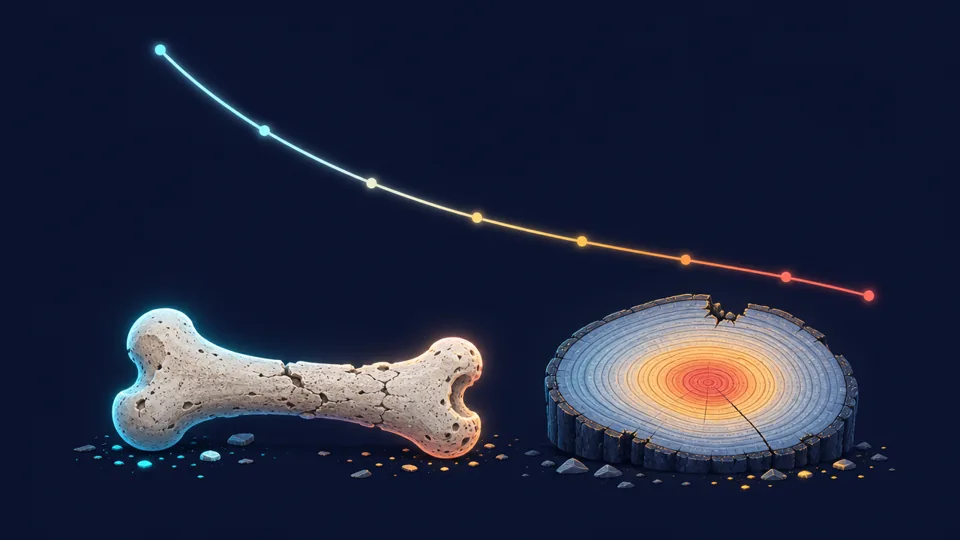
Radiometric dating of ancient remains
Carbon-14 dating
Living things constantly take in carbon, including a tiny, steady fraction of radioactive carbon-14. The moment something dies, the intake stops and the C-14 it already has starts running down with a half-life of 5,730 years.
Measure how much C-14 is left compared to a living sample, count the halvings, and you have the age.
Example. A bone has 25% of the C-14 a living bone would have. 100% → 50% → 25% is two halvings, so n = 2. Age = 2 × 5,730 = 11,460 years.
The limit. After about ten half-lives there is too little C-14 left to measure, so carbon dating tops out near 50,000 years. Anything older — rocks, fossils, the Earth itself — is dated with uranium-238 or potassium-40 instead, because those have half-lives in the billions of years.

One-minute videos

Nuclear decay and half-life (SPS4.b)
Fission & fusion (SPS4.a)
If the isotope symbols on this page are not making sense yet, do Nuclear Notation & Radioactive Decay first.

How are you feeling about this today?

Nothing here is graded. Switch levels any time.

Printable worksheets

Student page first, answer key on the next page. Shuffle to pull a fresh set.

Every worksheet prints the half-life data it needs at the top, so students do not need the table on the wall. Level 3 prints a blank decay graph to read values off.

Standard and targets

Georgia SPS4.b — Use mathematics and computational thinking to explain the process of half-life as it relates to radioactive decay.

The verb is use mathematics and computational thinking, so the page deliberately teaches three routes to the same answer: a halving table, the formula, and a graph. Students who cannot manage exponents can still succeed on every problem with the table, and the table is what makes the formula make sense when they get there.

  • Target 1: the definition, and half-life's independence from conditions.
  • Target 2: halving tables, fractions and percentages remaining.
  • Target 3: N = N0(½)n forwards and backwards.
  • Target 4: reading decay curves, and why they asymptote.

How the levels differ

Level 1 · Coach
One halving at a time, always with clean numbers. Fractions after n half-lives. Whether conditions change half-life. The coach says "divide the time by the half-life first" before every calculation item.
Level 2 · Guided
Two-step problems: find n, then halve n times. Mass, fraction, and percentage remaining. Distractors are built from the actual errors — subtracting instead of halving, dividing by n, off-by-one on the halvings.
Level 3 · Challenge
Solve for elapsed time and for the original mass. Carbon dating from a percentage. Read a value off a plotted curve. Items where n is not a whole number, so estimating between two halvings is required.

Misconceptions this page argues with by name

  • "Half-life is half the time until it is gone." Corrected in the opening box and again every time a student picks the "all gone after two half-lives" distractor.
  • "After two half-lives it is all gone." Zero is offered as an option on many Level 1 and 2 items precisely so it can be refuted with the halving arrows.
  • "Subtract the same amount each time." The linear answer (80 → 40 → 0) is a standing distractor, and the feedback shows the halving chain side by side with it.
  • "Heat, pressure, or amount changes half-life." Its own question type at Level 1, and the reason is given: decay is nuclear, and nothing chemical reaches the nucleus.
  • "The curve hits zero." Addressed at the graph and in the simulator, which visibly slows without stopping.

Classroom notes

  • Run the simulator twice before you say a word. Same isotope, same 400 atoms, and the numbers come out slightly different each time. Ask why. That question opens up the statistical nature of decay better than any explanation.
  • The penny lab pairs perfectly. 100 pennies, shake, remove the heads, record, repeat. The class data will trace the same curve as the simulator. Do the lab, then run the simulator with 400 atoms and ask why the digital one looks smoother.
  • Insist on the two-step layout — write n = t ÷ t½ on its own line, every single time. Nearly every wrong answer in this unit comes from trying to do it in one move.
  • Build the halving table on the board as a class for the first problem, then let the page's table tool take over. Students who keep using the table instead of the formula are still meeting the standard.
  • The waste connection is worth previewing here. Ask how long plutonium-239 (24,100 years) needs to be stored before it is mostly gone. Ten half-lives is roughly a quarter of a million years. That number does the arguing for you on the nuclear energy page.
  • Nothing is collected: no names, no codes. Numbers are freshly generated each time.